Last Updated on June 14, 2024
In our previous article, we explored the fundamentals of Spring Boot observability. We focused on how Micrometer, a popular metrics facade, integrates with Spring Boot to collect valuable application metrics.
In this article, we’ll explore how Spring Boot simplifies Logback configuration for your applications. We’ll also discover how Loki, a log aggregation system, can work with Grafana, a popular visualization tool, both from Grafana Labs . This combination allows you to capture detailed logs from your applications and visualize them within Grafana for deeper insights.
Spring Boot Logging
Spring Boot leverages Apache Commons Logging (CCL) for internal logging.
It provides sensible defaults for common logging frameworks like Logback and Log4j2. These defaults enable basic logging to the console out of the box, without much configuration on your part.
Loggers in Spring Boot are objects that represent categories of messages within your application. You can create loggers for specific parts of your code (e.g., a logger for a service or a controller).
You can define the severity of a log message. Common levels include TRACE (most detailed), DEBUG, INFO, WARN, ERROR, and FATAL. Spring Boot defaults to INFO level, logging important events but not overwhelming you with too much detail.
And Appenders specify where log messages are sent.
By default, Spring Boot uses a console appender, writing logs to the standard output stream (usually the console window).
Logging in spring boot need import spring-boot-starter-logging starter library and as any other starter library, such as spring-boot-starter-web depends on spring-boot-starter-logging it does not need any configuration
When using starters default logging library is logback with logging level set to INFO.
As we said, Spring Boot uses Logback by default.
Let’s configure it for better readability with colors, a clear log pattern, separate console and file logging, and a way to control log file size.
When a file in the classpath (by default in src/main/resources folder) has one of the following names, Spring Boot will automatically load it over the default configuration:
- logback-spring.xml
- logback.xml
- logback-spring.groovy
- logback.groovy
If we have sample logback-spring.xml file:
<?xml version="1.0" encoding="UTF-8"?>
<configuration>
<property name="LOG_PATH" value="logs" />
<property name="LOG_PATTERN" value="%d{yyyy-MM-dd HH:mm:ss.SSS} [%-5level] %-40.40logger{39} : %msg%n" />
<!-- console input -->
<appender name="consoleLog" class="ch.qos.logback.core.ConsoleAppender">
<!-- color log -->
<layout class="ch.qos.logback.classic.PatternLayout">
<pattern>
%d{yyyy-MM-dd HH:mm:ss} [%thread] %magenta(%-5level) %green([%-50.50class]) >>> %blue(%msg) %n
</pattern>
</layout>
</appender>
<appender name="fileLog" class="ch.qos.logback.core.rolling.RollingFileAppender">
<rollingPolicy class="ch.qos.logback.core.rolling.TimeBasedRollingPolicy">
<FileNamePattern>${LOG_PATH}/cms.%d{yyyy-MM-dd}.%i.log</FileNamePattern>
<timeBasedFileNamingAndTriggeringPolicy class="ch.qos.logback.core.rolling.SizeAndTimeBasedFNATP">
<maxFileSize>100MB</maxFileSize>
</timeBasedFileNamingAndTriggeringPolicy>
<MaxHistory>30</MaxHistory>
</rollingPolicy>
<encoder class="ch.qos.logback.classic.encoder.PatternLayoutEncoder">
<pattern>${LOG_PATTERN}</pattern>
</encoder>
</appender>
<root level="info">
<appender-ref ref="consoleLog" />
<appender-ref ref="fileLog" />
</root>
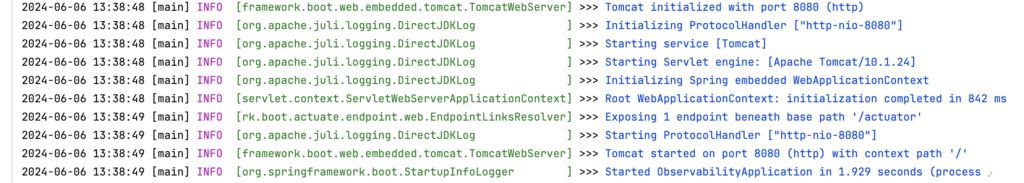
</configuration>The output in the application console looks like this
How can we configure logging to send logs to a destination other than the console?
We can use Grafana Loki for that.
Spring Boot Logging with Loki
We need to include following dependency to pom.xml
<dependency>
    <groupId>com.github.loki4j</groupId>
    <artifactId>loki-logback-appender</artifactId>
    <version>1.4.1</version>
</dependency>
The loki-logback-appender intercepts these messages.
The appender formats the logs with labels and timestamps and sends them to the Loki server.
Loki stores the logs and indexes the labels and metadata for efficient searching.
You can configure a Grafana datasource to connect to your Loki server. Grafana Loki will be responsible for collecting and aggregating the logs, while we can visualize the logs in Grafana Dashboard.
For a simplified approach, we’ll use Docker containers to deploy both Loki and Grafana. This containerization technology minimizes configuration efforts and streamlines the service execution.
Here’s a docker-compose.yml file to set up Loki and Grafana services:
version: "3"
networks:
  loki:
services:
  loki:
    image: grafana/loki:2.9.0
    ports:
      - "3100:3100"
    command: -config.file=/etc/loki/local-config.yaml
    networks:
      - loki
  grafana:
    environment:
      - GF_PATHS_PROVISIONING=/etc/grafana/provisioning
      - GF_AUTH_ANONYMOUS_ENABLED=true
      - GF_AUTH_ANONYMOUS_ORG_ROLE=Admin
    entrypoint:
      - sh
      - -euc
      - |
        mkdir -p /etc/grafana/provisioning/datasources
        cat <<EOF > /etc/grafana/provisioning/datasources/ds.yaml
        apiVersion: 1
        datasources:
        - name: Loki
          type: loki
          access: proxy
          orgId: 1
          url: http://loki:3100
          basicAuth: false
          isDefault: true
          version: 1
          editable: false
        EOF
        /run.sh
    image: grafana/grafana:latest
    ports:
      - "3000:3000"
    networks:
      - loki
To start the services, use the docker-compose command:
docker-compose upTo verify if the services are running, use the docker ps command:
docker psBy now, we should see something like this:

Grafana service is deployed and started on: http://localhost:3000
Next, We set up Loki service endpoint in logback-spring.xml
<?xml version="1.0" encoding="UTF-8"?>
<configuration>
    <appender name="LOKI" class="com.github.loki4j.logback.Loki4jAppender">
        <http>
            <url>http://localhost:3100/loki/api/v1/push</url>
        </http>
        <format>
            <label>
                <pattern>app=${name},host=${HOSTNAME},level=%level</pattern>
                <readMarkers>true</readMarkers>
            </label>
            <message>
                <pattern>
                    %d{yyyy-MM-dd HH:mm:ss} [%thread] %magenta(%-5level) %green([%-50.50class]) >>> %blue(%msg) %n
                </pattern>
            </message>
        </format>
    </appender>

    <root level="INFO">
        <appender-ref ref="LOKI" />
    </root>
</configuration>
and if we call our root endpoint several tomes again:
GET http://localhost:8080/Our service logs are sent to the Loki service because of the configuration setup with the loki-logback-appender.
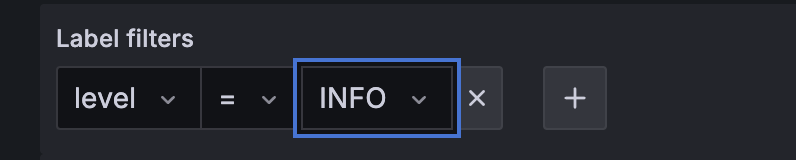
An because Lokiserver is default Grafana data source, we can see our logs by going to http://localhost:300, Explore menu, and setting the level filters to INFO
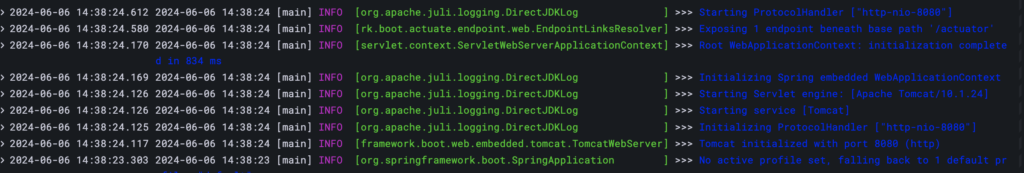
If we Hit “Run Query”, we see our logs exported and visualised in Grafana
Conclusion
In this article, we’ve explored a powerful combination of tools for log management and visualization: Spring Boot, Logback, Loki, and Grafana.
By leveraging this integrated approach, we gain a comprehensive understanding of our Spring Boot applications’ health and behavior. We can identify errors quickly, track application performance, and gain valuable insights into user interactions.
This empowers us to make informed decisions for optimizing your applications, streamlining operations, and ultimately, delivering a superior user experience.